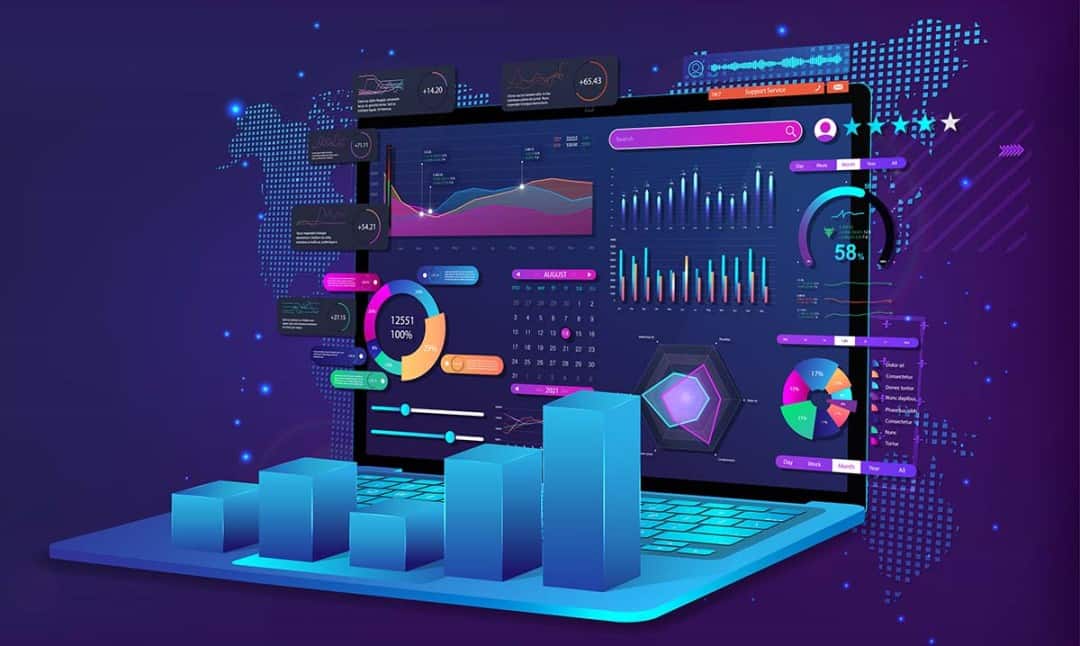
Nonprofits are always looking for new and innovative ways to communicate their message to the public. One effective way to do this is through data visualization. Data visualization is a method of presenting data in a graphical form, which makes it easier for people to understand. It can be used to tell your nonprofit's story, showcase your impact, or highlight your work in a clear and concise way.
There are many ways to visualize data, and the best way to do it will depend on what kind of data you have and what you want to achieve. Some common types of data visualizations include charts, graphs, maps, infographics, and timelines.
How to use data visualization to tell your nonprofit's story
When it comes to nonprofit communication, data visualization is one of the most powerful tools at your disposal. By creating graphs, charts, and other visuals, you can make complex data easy to understand for your audience. This not only helps you get your message across more effectively, but it also makes your organization look professional and knowledgeable. There are many ways to use data visualization in your communications, so let's take a look at some of the most common applications.
Tips for creating effective data visualizations
When it comes to creating data visualizations, there are a few things to keep in mind to make them as effective as possible. Here are some tips to help you get started:
1. Make sure your data is accurate and up to date. Nothing looks worse than a visualization that is based on outdated information.
2. Choose the right type of visualization for your data. There are many different types of graphs and charts, so find one that will best illustrate your data.
3. Use clear and concise titles and labels. Your audience should be able to understand your visualizations without having to read the accompanying text.
4. Be careful with color. It's important to use colors that will make your data easy to see and understand. However, you don't want to create a visualization that is so busy or distracting that people can't focus on the data itself.
5. Keep your visuals simple. The goal is to present your data in a clear and easy-to-understand way, so avoid using complex graphics or animations.
There are many resources available for nonprofits who want to learn more about data visualization. Here are a few of the best ones:
1. The Data Visualization Society is a nonprofit organization that provides education and resources on data visualization. They offer online courses, webinars, and other resources to help people learn how to create effective data visualizations.
2. The Information Is Beautiful Awards is an annual competition that celebrates the best data visualizations from around the world. The winners are announced each year at a special ceremony in London, and all the winning entries are published on the Information Is Beautiful website.
3. Tableau is a software company that specializes in data visualization. They offer free tutorials and training materials on their website, as well as a variety of software products that can help you create beautiful data visualizations.
4. Looker Studio (formerly Google Data Studio) is a free data visualization tool offered by Google. It allows you to create interactive graphs and charts, and you can easily share your visuals with others online.
5. Thinking with Data: How to Turn Information into Insights by Max Shron
Data visualization is a powerful tool that can help nonprofit organizations communicate their message more effectively. By creating graphs, charts, and other visuals, you can make complex data easy to understand for your audience. In addition, there are many resources available to help you learn how to create effective data visualizations. So, what are you waiting for? Start exploring the world of data visualization today!